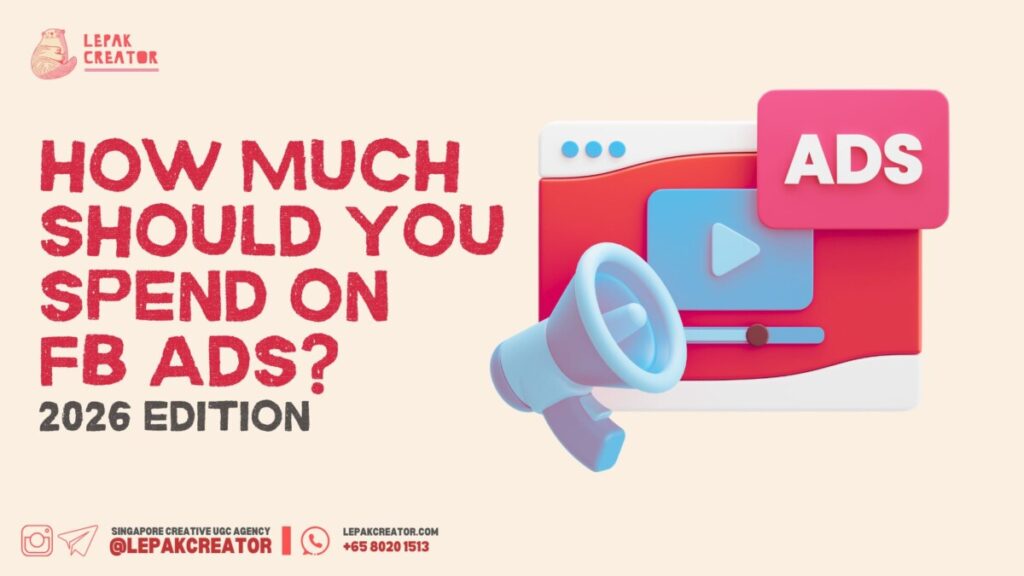
If you’ve ever asked yourself, “How much should I spend on Facebook ads?”—you’re not alone. There’s no magic number. Your budget depends on your goals, audience, and willingness to test and tweak campaigns. The key is having a flexible strategy that makes every dollar count.
A budget strategy ensures you target the right audience, avoid wasting money, and get the most out of every campaign. It also helps you decide how many ad sets to run, when to tweak them, and when to scale. Think of it as a roadmap to turning ad spend into measurable results.
Step 1: Define Your Campaign Goals
Before setting your budget, clarify what you want your ads to achieve. Facebook campaigns fall into six main objectives:
| Objective | Purpose / Best For |
|---|---|
| Awareness | Build brand recognition and visibility |
| Traffic | Drive people to your website or app |
| Engagement | Boost likes, comments, and interactions |
| Leads | Collect emails or sign-ups |
| App Promotion | Encourage app downloads or usage |
| Sales | Optimize for purchases and conversions |
Tip: Small businesses usually get the best ROI from Sales or Leads, while awareness campaigns work for local trust-building.
Step 2: Start Small and Test
Jumping in with a huge budget can backfire. Start small, gather data, and scale gradually. Key points to remember:
- Start with $20–$35/day per ad set; $50/day for high-ticket items.
- Run A/B tests: images vs videos, different headlines, audience segments.
- Observe competitor ads to identify what works and adapt strategies.
- Focus on your top 3 products for testing.
- Retarget visitors using Facebook Pixel; budget $30–$100 per ad set depending on audience size.
Step 3: Monitor Performance
Metrics to track and benchmarks to guide your decisions:
| Metric | Benchmark / Tip |
|---|---|
| ROAS | Aim for 3+ |
| Cost per Purchase (CPP) | Depends on product price and sales goal |
| Conversion Rate | ~9% average, varies by industry |
| CPM / CPC | CPM ~$5.61, CPC ~$0.40 |
| CTR | ~1.5%, but lower CTR can still give ROI |
| Frequency | Acquisition <3, Retargeting 5–6, Retention 8–9 |
Pro tip: If an ad set isn’t performing after 3 days, shut it down. Focus on underperforming ad sets first, then drill into individual ads. Always review performance daily using 3–7 day windows. If an ad spends more than twice your target CPA without hitting KPIs, pull the plug. Staying proactive ensures every dollar works harder.
Step 4: Base Your Budget on Audience Size
Define your audience using Facebook’s targeting tools—demographics, location, and interests. Broader audiences increase reach but can reduce ad relevance and raise costs. Well-defined audiences often lead to higher engagement and more effective spending.
Step 5: Adjust and Scale
Once you know what works, it’s time to scale thoughtfully. Key guidelines:
- Increase budgets gradually, 10–20% per week to keep campaigns stable.
- Refine audiences and focus on top-performing ads.
- Duplicate successful ads with the same post ID to carry over likes, comments, and engagement. Social proof boosts credibility and performance.
How Facebook Ad Costs Work
Facebook Ads operate on an auction system, which means your costs aren’t fixed—they depend on three main factors: your budget and bid, your bidding strategy, and your target audience. Billions of auctions run daily, and winning isn’t just about paying the most. Ads with higher relevance scores and engaging creatives often cost less per click or impression, even if their bid is lower.
Campaign objectives also influence costs. Ads focused on conversions, like catalog sales or lead generation, tend to cost more because they target people closer to purchase. Awareness campaigns are generally cheaper, since broad visibility is the goal rather than immediate action.
Advertisers can pay in several ways depending on campaign goals:
| Pricing Model | How It Works | Example |
|---|---|---|
| CPC (Cost per Click) | Pay only when someone clicks your ad | $0.70 per click for a flash sale |
| CPM (Cost per 1,000 Impressions) | Pay per 1,000 ad views | $13.57 per 1,000 impressions for brand awareness |
| CPA (Cost per Action) | Pay when a user completes a desired action | $18.68 per signup for a SaaS trial |
| CPL (Cost per Like / Lead) | Pay per new page like or lead | $1.20 per follower on a promotion |
💡 Pro tip: CPC works best when your site is ready and you want motivated traffic. CPM is ideal for awareness campaigns or testing audiences before moving to conversions. CPA ensures you pay only for actions that matter, maximizing ROI.
Average Costs and Trends
Facebook ad costs fluctuate based on industry, audience, seasonality, and even platform changes like privacy updates. Benchmarks from recent years give useful context:
| Metric | Average (2024-2026) |
|---|---|
| CPC | $0.70 |
| CPM | $13.57 |
| CPA | $18.68 |
| CTR | 0.90% |
Example: if you pay $0.70 per click for a flash sale, tracking CTR can help you optimize creatives. Improving ad relevance (like using testimonials or seasonal messaging) reduces CPC while keeping engagement high.
Costs also vary seasonally: during high-competition periods (like Monthly online sales, 7.7, 8.8, 12.12), increase bids by 10–15%. During slower periods, you can safely lower them. If your actual CPC is below your bid cap, shave off a few cents without hurting performance—this keeps your budget lean.
Facebook Ad Costs by Industry
Facebook advertising costs vary widely across industries due to audience value, competition, and conversion complexity. Understanding these differences helps you set realistic budgets and optimize your campaigns.
| Industry | Avg CPC | Avg CPM | Avg CPA |
|---|---|---|---|
| Legal Services | $1.81 | $11.31 | $28.70 |
| Fintech | $2.55 | $19.35 | $40.00 |
| Healthcare | $1.32 | $5.78 | $12.31 |
| Retail | $0.70 | $1.38 | $21.47 |
| Real Estate | $1.81 | $10.97 | $16.92 |
| Gaming | $0.57 | $8.90 | $29.00 |
| Education | $1.06 | $5.31 | $7.85 |
| Digital Marketing | $1.38 | $7.19 | $23.10 |
| Travel & Tourism | $0.63 | $9.89 | $22.50 |
| Automotive | $0.45 | $6.81 | $43.84 |
| E-commerce | $0.45 | $5.33 | $45.00 |
| B2B | $2.52 | $22.50 | $23.77 |
| Apparel | $0.45 | $5.99 | $10.98 |
| Beauty | $1.81 | $13.91 | $25.79 |
| Finance & Insurance | $3.77 | $11.37 | $41.43 |
| Fitness | $1.90 | $14.02 | $13.29 |
| Technology | $1.27 | $9.98 | $55.21 |
| Home Improvement | $2.93 | $12.17 | $44.66 |
💡 Key takeaways:
- Finance, insurance, fintech, and technology campaigns cost more due to niche audiences and complex buying decisions.
- Retail, apparel, and e-commerce often have lower costs, targeting broader, impulse-driven audiences.
- Automotive has low CPC but high CPA, reflecting inexpensive clicks but costly conversions.
Businesses in high-cost industries can optimize spend by:
- Using Conversions API to sync website and offline data with Meta.
- Enabling Automatic Placements to let Facebook show ads in optimal spots.
- Optimizing for high-value customers using Meta’s value optimization.
- Setting up automation rules for budget and targeting adjustments based on real-time performance.
Factors That Affect Facebook Ad Costs
Factor 1: Target Audience
The more specific your audience, the higher the CPM, but also the better the conversion potential. Consider:
- Demographics: Age and gender targeting affects costs; 25–34-year-olds are in high demand.
- Location: Urban areas are more expensive due to competition.
- Interests: Niche interests like luxury travel or real estate cost more but reach high-value users.
Tip: Test different combinations of age, gender, and location to find cost-effective audiences. Example: Tata Housing targeted aspirational Goan lifestyle video ads and sold 250 homes with highly focused targeting.
Why This Matters for Budgeting
Understanding how costs work allows you to plan months ahead, avoid overspending, and tweak bids effectively. Combined with the earlier steps—defining goals, testing small, monitoring performance, and scaling carefully—you can ensure each dollar you spend goes further and drives real results.
Not sure how to segment audiences or optimize bidding without overspending? Our team can handle everything for you – from targeting to creative – so you can focus on running your business. Talk to us now!
Factor 2: Ad Placement Content
Where your ad appears affects cost and engagement.
| Placement | Specs | Potential Reach |
|---|---|---|
| News Feed | Image: 1200×628px, Video: 16:9 or 1:1 | Broad, high engagement |
| Marketplace | Image: 1200×1200px, Text: 90 chars | High among in-market shoppers |
| Video Feeds | Video: 4:5 or 1:1, Text: 125 chars | Strong motion-based engagement |
| Right Column | Image: 1200×1200px, Headline: 25 chars | Lower reach, lower CPM |
| Stories | Image/video: 1080×1920px, ≤20% text | High among younger audiences |
| In-Stream Video & Reels | Video: 9:16 or 1:1 | Engaged viewers already watching content |
| Search Results | Image: 1200×628px, Headline: 90 chars | Niche, active searchers |
| Instant Articles | Image: 1200×628px, Text: 125 chars | Readers of publisher content |
Choosing placements wisely allows you to balance cost with audience engagement and ad relevance.
Integrating this section with your previous guide will:
- Give industry-specific benchmarks for CPC, CPM, and CPA.
- Explain why costs differ by audience and placement.
- Offer actionable tips for cost optimization, which is especially helpful for small businesses and high-competition industries.
Factor 3. Seasonality
Ad costs fluctuate with the calendar. Peak shopping periods like the holidays, and back-to-school season naturally push CPC and CPM higher due to increased competition. Expect spikes of 20–30% for CPC and 25–40% for CPM during these times.
Example: Pandora Jewelry launched a holiday video campaign in November–December. Even with CPM 30% higher than usual, purchases increased by 61%, and new customers grew 42%, proving timely campaigns can justify higher spend.
Budget tips for seasonal peaks:
- Plan ahead for known peaks and set bids in advance.
- Shift spend to slower periods to take advantage of discounts.
- Align creatives with seasonal themes to boost engagement and offset higher costs.
Worried about skyrocketing ad costs during holiday seasons? We can create and schedule high-performing campaigns that work even during peak competition. We can handle it for you.
Factor 4. Competition
Facebook ad costs also reflect supply and demand. More advertisers chasing the same audience naturally drives prices up. For example, bidding $0.50 per click on “new moms in Seattle” might win most auctions alone—but add a few competitors, and that winning bid could rise to $0.75–$0.80.
Ways to manage competition:
- Use Facebook Ad Library to track competitors’ ads.
- Test adjacent or niche audiences (e.g., “parents of toddlers” instead of “new moms”).
- Run ads during off-peak hours or days.
- Refresh creatives frequently; higher relevance can lower costs.
By monitoring competitors and adjusting audience targeting, timing, and creatives, you only bid aggressively when necessary and avoid overspending in hot auctions.
These sections naturally follow your Factor 1 (Audience) and Factor 2 (Ad Placement) points.
Struggling to compete against bigger brands in Ad auctions? Our ad strategies help you maximize ROI even in competitive markets. Book a Free consultation now!
At the end of the day, there’s no one-size-fits-all answer to “how much should I spend on Facebook ads?” Crafting the right budget is about balance. Define your goals, start small, test thoroughly, monitor daily, and scale gradually. Each business is unique, so build a flexible framework that grows with your needs and ensures every ad dollar counts.
Facebook ads don’t have to feel like rocket science. Let us do the hard work – from strategy to execution – while you focus on growing your business. Get started now!
Before you go, take a look at…